Competing Exchange Interactions in Magnetic Multilayers B. Skubic, E. Holmström, D. Iusan, O. Bengone, O. Eriksson, R. Brucas, B. Hjörvarsson, V. Stanciu, and P. Nordblad Phys. Rev. Lett. 96, 057205 (2006)
We have studied alloying of the nonmagnetic spacer layer with a magnetic material as a method of tuning the interlayer coupling in magnetic multilayers. We have specifically studied the Fe/V(100) system by alloying the spacer V with various amounts of Fe. For some Fe concentrations in the spacer, it is possible to create a competition between antiferromagnetic Ruderman-Kittel-Kasuya-Yoshida exchange and direct ferromagnetic exchange coupling. The exchange coupling and transport properties for a large span of systems with different spacer concentrations and thicknesses were calculated and measured experimentally and good agreement between observations and theory was observed. A reduction in magnetoresistance of about 50% was observed close to the switchover from antiferromagnetic to ferromagnetic coupling.
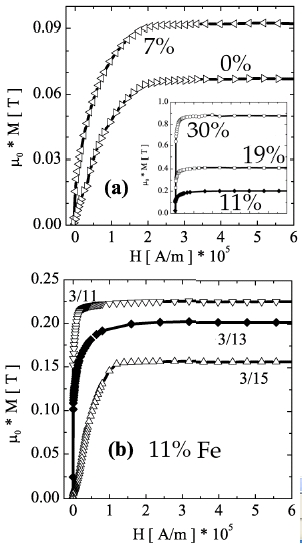
Field dependence of the magnetization for (a) Fe3/(FexV1—x-)13 multilayers with different alloying concentrations in the spacer, (b) Fe3/(Fe0.11V0.89)n multilayers with different thicknesses of the spacer. The amplitudes for the AFM coupled systems are Fe3V1-3-(-0%)- 0.011 mJ/m2, Fe3V1-3-(-7%)- 0.015 mJ/m2, and Fe3V1-5-(-11%)- 0.013 mJ/m2, but these values must be seen as a crude estimation due to difficulties to estimate the extent of the magnetic region.
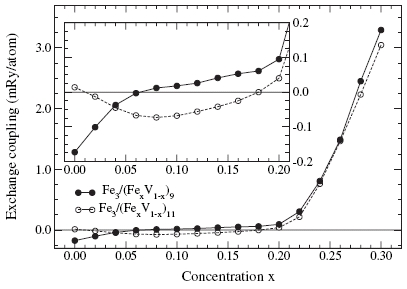
Calculated interlayer exchange coupling for two Fe/V multilayers with atomically sharp interfaces as a function of Fe concentration in the spacer layers. The inset shows a blowup of the concentration region with less than 20% Fe.
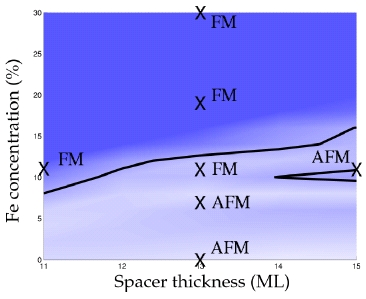
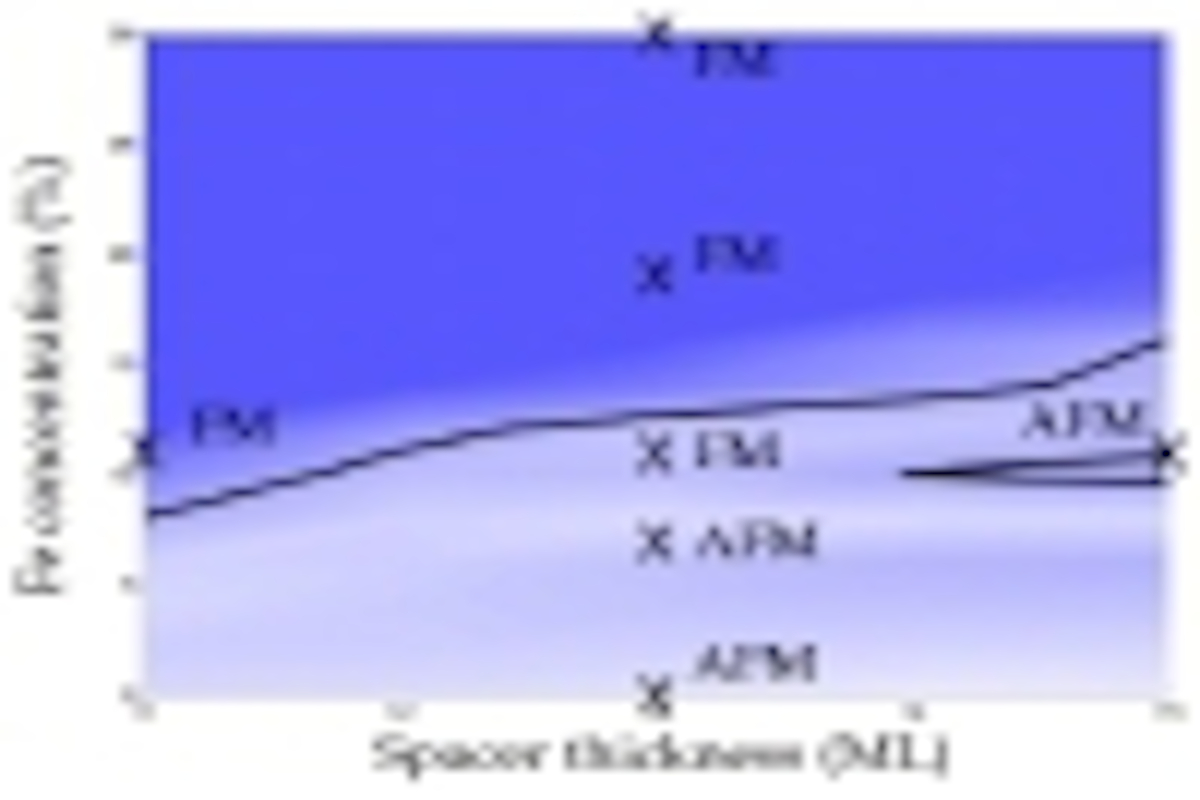
Magnetic phase diagram for Fe3/(FexV1—x-)n. The calculations include interface intermixing of -1.8 and a roughness of 1.35. The strength of the calculated IEC is represented by the blue scale (gray scale in the black and white version of the figure) where dark shades represent FM coupling and light shade represents AFM coupling. The black lines represent the border between the theoretical FM and AFM solutions. The experimental points are marked by X. The theoretical phase diagram was obtained by a linear interpolation of calculations for V thicknesses in steps of integer ML and Fe concentrations in steps of 2%. The amplitudes of the AFM samples with our choices of intermixing and roughness are Fe3V1-3-(-0%)- 0.3115 mJ/m2, Fe3V1-3-(-7%)- 0.1773 mJ/m2, and Fe3V1-5-(-11%)- 0.0055 mJ/m2.