Sub-10 nm CoPt nanoparticles were slowly grown at 400°C in epitaxy on a NaCl substrate. Their faceted shape was analyzed using state-of-the-art TEM techniques: aberration-corrected imaging, electron tomography and probe-aberration-corrected scanning transmission electron microscopy. These nanoparticles consist in truncated octahedrons with a chemically disordered face centered cubic (FCC) structure (Fig. 1).
We evidenced slight variations of the truncation of these nano-octahedrons depending on their size: the largest particles are less truncated than the smallest particles. We also highlighted the up-down symmetry of the NPs, suggesting that the adhesion energy of FCC–CoPt on NaCl is negligible (Fig. 2). Energy descriptions of these NPs were made by using quenched molecular dynamic in the framework of the second moment approximation of the tight-binding formalism, while taking into account the random distribution of Co and Pt atoms (Fig. 3).
In a general manner, this original energy approach for studying faceting in chemically disordered nanoalloys is consistent with experimental results, particularly for small-size clusters. However, as the experimentally observed size-effect on the NPs truncation was not theoretically predicted, this phenomenon could originate from kinetic effects inherent to nanocrystal growth.
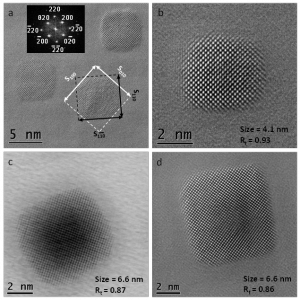
Figure 1: Aberration-corrected high resolution imaging of CoPt NPs in HRTEM mode (a), (b) and (d) and bright field STEM mode (c). The white (or black) square in image (a) indicates the NP size along the [100] and [010] (or [110] and [1-10]) directions (S100 and S010 or S110 and S1-10, respectively). These atomic-scale measurements are used to quantify the truncation of the octahedrons along the <001>-type directions via the Rt ratio Rt = -S110 / -S100.
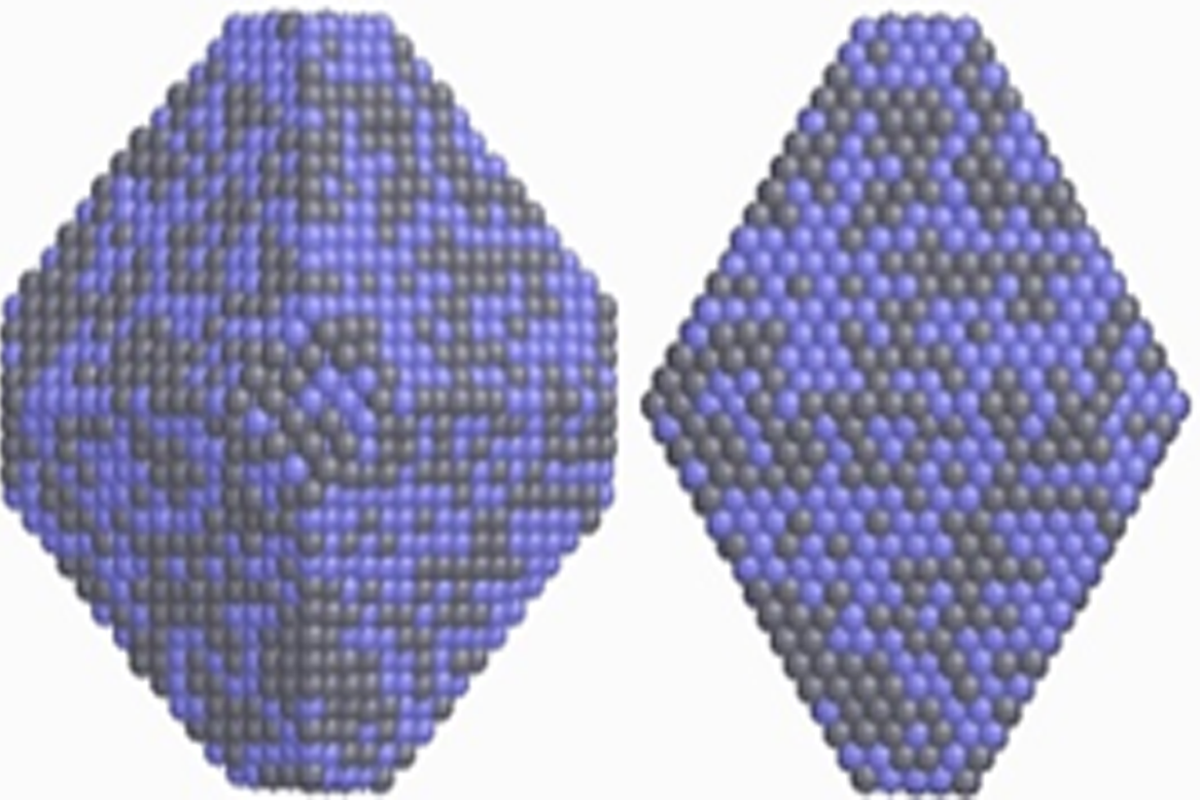
Figure 2: Comparison between the 3D reconstruction of a single CoPt NP obtained by electron tomography and a relaxed model truncated octahedron with a size of 7.5 nm along the <110>-type directions and 8.2 nm along the <100>-type directions. The truncation ratio, Rt = -S110 / -S100, where Shkl is the NP size along the [hkl] direction, equals 0.92. The Co and Pt atoms are shown as spheres of slightly different radii. 3D volumes are observed along the [001] (a), [0-10] (b), and [110] (c) directions. The z = 0, x = 0, x+y = 0 slices extracted from the tomogram are shown in inset.
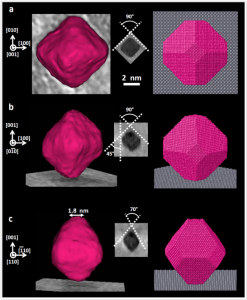
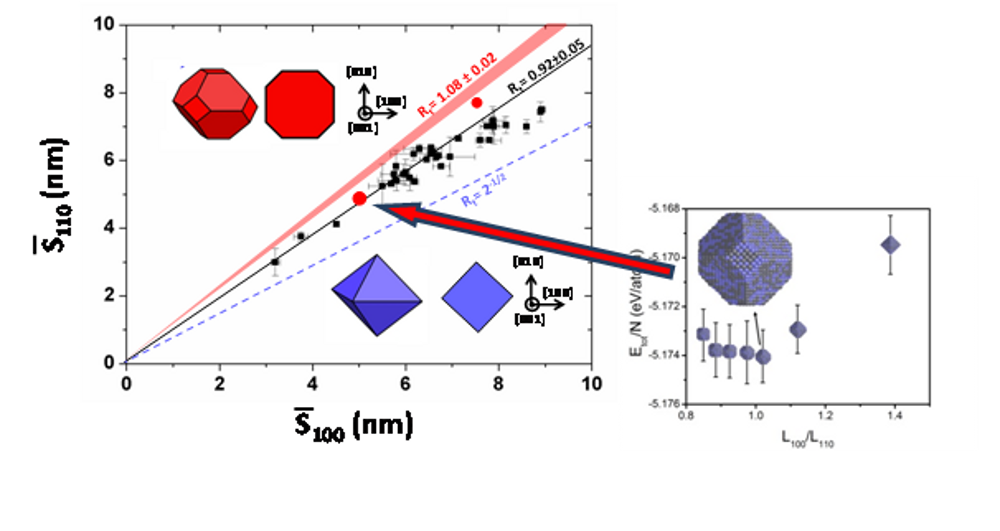
Figure 3: Size along the <110>-type directions (-S110) as a function of the size along the <100>-type directions (-S100). To take into account the slight anisotropy of the NPs along the [110] or [1-10] directions, error bars are defined as (S110 – S1-10) / 2 and (S100 – S010) / 2, along the abscissa and ordinate axes, respectively (highly anisotropic NPs were not measured). Black squares and red circles correspond to experimental and calculated data respectively. The truncation of the NPs is characterized by the ratio Rt = -S110 / -S100. The blue dashed line corresponds to the non-truncated octahedrons (Rt = 2-1/2), shown in 3D and in [001]-projection in the bottom inset. The red area corresponds to the truncated octahedrons with Rt = 1.08 ± 0.02, according to Wulff’s construction (shown in 3D and in [001]-projection in the top inset). The black solid line indicates the mean value of the experimental Rt ratios (0.92 ± 0.05). Right panel: minimization of total energy for nanoparticles with 4579 atoms and various truncations.