Lattice dynamics and migration enthalpies in CoPt3 and FePd
T. Mehaddene, E. Kentzinger, B. Hennion, K. Tanaka, H. Numakura, A. Marty, V. Parasote, M. C. Cadeville, M. Zemirli, and V. Pierron-Bohnes
PHYSICAL REVIEW B 69, 024304 (2004)
Collaboration with the Leon-Brillouin Laboratory (Saclay), the University of Tizi-Ouzou (Algeria) and the University of Kyoto (Japan)
The frequencies of the normal modes of vibration of CoPt3 and FePd single crystals have been measured using inelastic neutron scattering. The measurements were performed in the L12 ordered phase (at 300 and 930K) for CoPt3 and in the L10 ordered phase (at 300 and 860K) for FePd. Dispersion curves were also measured in the fcc disordered states, at 1060 and 1020K for CoPt3 and FePd, respectively. The activation enthalpy of atomic migration has been evaluated from the phonon density of states by applying Schober’s model (H. R. Schober et al., J. Phys. : Condens. Matter 4, 9321 (1992)) and its extension to the L12 ordered structure. The phonon properties of FePd3 reported in the literature have been analysed similarly and are compared with the results for CoPt3 and FePd. The contribution of the long-range order to the migration enthalpy estimated in the present analyses agrees well in magnitude with the previous evaluation by Monte Carlo simulation for alloys of the fcc, L12 and L13 structures.
Phonon dispersion curves at 300 K (FePd L10 phase). The open circles correspond to the experimental data and the lines to the Born-von Karman fits. The solid and dashed lines correspond to the longitudinal and transversal polarisations, respectively.

Phonon dispersion curves at 300 K (CoPt3 L12 phase). The open circles correspond to the experimental data and the lines to the Born-von Karman fits. The solid and dashed lines correspond to the longitudinal and transversal polarisations, respectively.
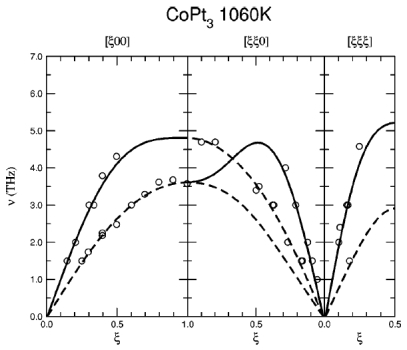
Phonon dispersion curves at 1060 K (CoPt3 fcc phase). The open circles correspond to the experimental data and the lines to the Born-von Karman fits. The solid and dashed lines correspond to the longitudinal and transversal polarisations, respectively.
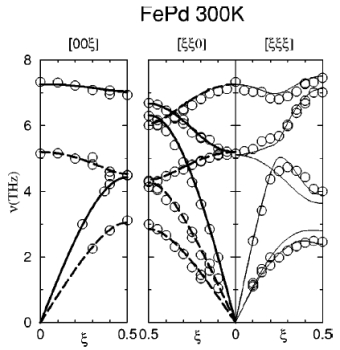
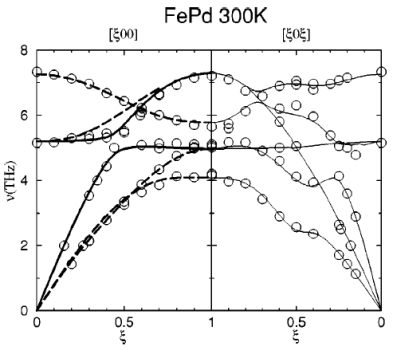
Phonon dispersion curves at 300 K (FePd L10 phase). The open circles correspond to the experimental data and the lines to the Born-von Karman fits. The solid and dashed lines correspond to the longitudinal and transversal polarisations, respectively.

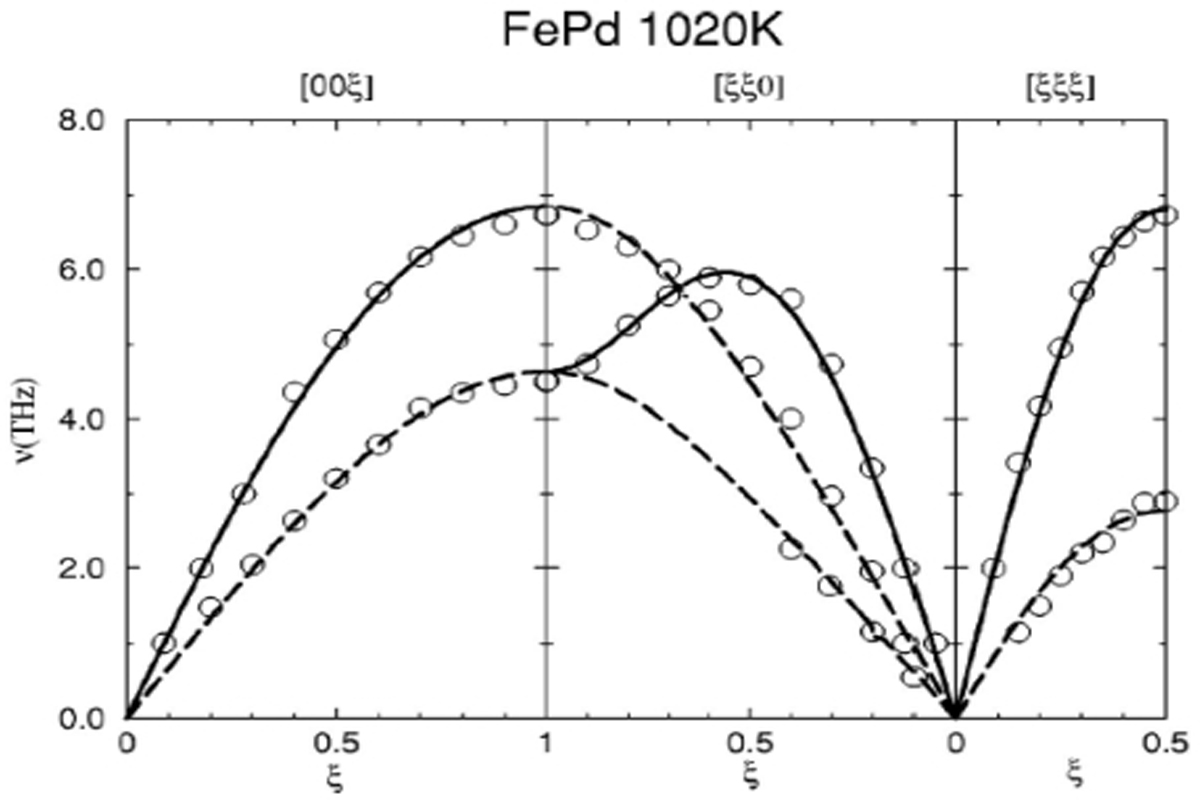
Phonon dispersion curves at 1020 K (FePd fcc phase). The open circles correspond to the experimental data and the lines to the Born-von Karman fits. The solid and dashed lines correspond to the longitudinal and transversal polarisations, respectively.
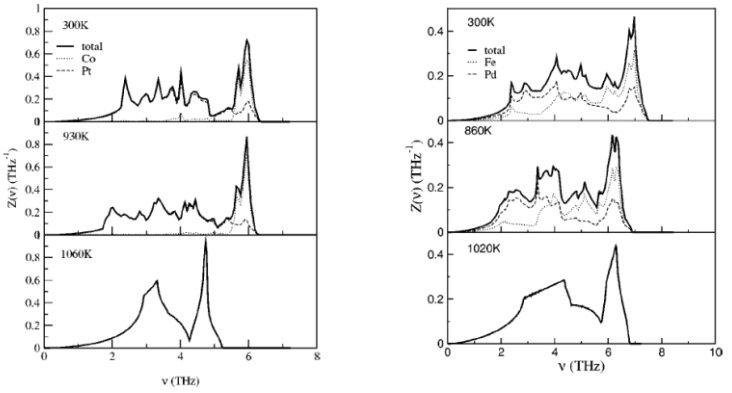
Total and weighted phonon density of states in CoPt3 and FePd at various temperatures.